
Program: Multivariate Analysis 1
Solution of the below questions is available here : Code
Question 1:
The PotteryData.csv dataset (posted on Blackboard) examines the chemical composition of Romano-British pottery. The data record the chemical composition of 45 pots, determined by atomic absorption spectrophotometry, for nine oxides, as well as the location (the kiln) at which the pottery was found. The nine oxides are Al2O3 (aluminium trioxide), Fe2O3 (iron trioxide), MgO (magnesium oxide), CaO (calcium oxide), Na2O (natrium oxide), K2O (calium oxide), TiO2 (titanium oxide), MnO (mangan oxide) and BaO (barium oxide). In all questions, provide details of your reasoning and fully commented R code.
1 (a) (i) Using R, calculate the covariance matrix Σ for the nine chemicals. [2 marks]
1 (a) (ii) Using R, what are the first two eigenvalues and eigenvectors of Σ? Using R, show that they are indeed eigenvalues and eigenvectors of Σ. [4 marks]
1 (a) (iii) Using R, verify that the first two eigenvectors are orthonormal. [2 marks]
1 (a) (iv) Would you advise standardizing the pottery data prior to analysis? Explain your reasoning. [2 marks]
1 (b) Suppose E[X1] = 10 and V ar[X1] = 11. Suppose E[X2] = 8 and V ar[X2] = 14. Suppose also that the covariance between X1 and X2 is 2.
1 (b) (i) In R, calculate the expected value and variance of X1 − X2. [2 marks]
1 (b) (ii) In R, calculate the correlation of U = X1 − X2 and V = X1 − 2X2. [3 marks]
Question 2:
Return to the same pottery dataset you explored in Question 1 and consider the nine oxides.
2 (a) In R, cluster the 45 pots using k-means clustering. How many clusters would you suggest are present in this data set? Detail any decisions you make when running this procedure. Provide details of your reasoning and fully commented R code. [5 marks]
2 (b) Cluster the 45 pots using hierarchical clustering and average linkage. From the dendrogram, how many clusters would you suggest are present in this data set? Cut the dendrogram at the desired number of clusters. [3 marks]
2 (c) Compare the cluster solutions obtained in (a) and (b) using an appropriate measure and comment on the agreement between the two solutions (HINT: use the mclust package). Provide details of your reasoning and fully commented R code. [3 marks]
2 (d) Comment on the relationship between both clustering solutions and the ‘kiln’ variable. Have you any concerns about the reproducibility of your clustering solutions? [4 marks]
Question 3:
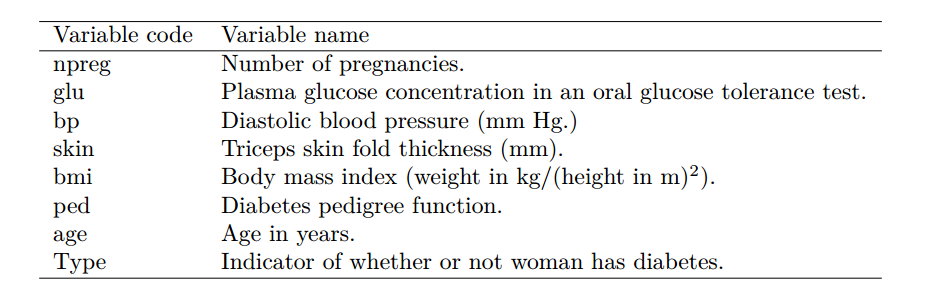
A population of women who were at least 21 years old, of Pima Indian heritage and living near Phoenix, Arizona was tested for diabetes, according to World Health Organisation criteria. The data are available on Blackboard, in the file Pima.csv. The recorded variables are:
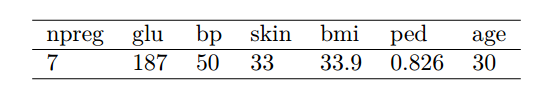
3 (a) In R, write your own function to calculate the quadratic discriminant function δk(x) for k = 1, 2 where x is the set of variables for a new member of the Pima Indian population (who satisfies the study criteria), as detailed in the table below. Does the new population member suffer from diabetes? Explain how you arrived at your answer. [20 marks.]
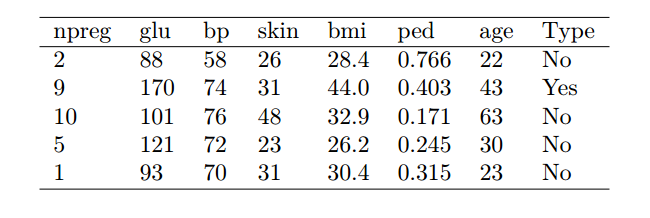
3 (b) The five members of the Pima Indian population in the table below were initially set aside as a test set. Using the model fitted in part (a), calculate the misclassification rate of your quadratic discriminant analysis model. [20 marks.]
Question 4:
Suppose we have i = 1, . . . , N observations on p variables xi = (xi1, . . . , xip)T and it is known that each
observation belongs to one of two classes. Class A contains NA observations and class B contains NB
observations (NA + NB = N). If the prior probability of belonging to classes A and B are NA/N and NB/N
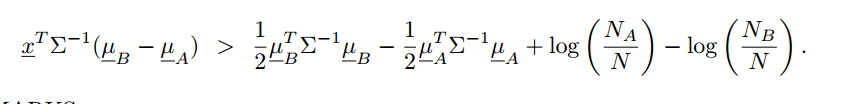
respectively show that the linear discriminant analysis rule classifies an observation x to class B if: